Live command center for ISPs, dealers, and field teams NewLatency Radar heat map, Network Engineering and tools that run inside your network

Know what broke, who is affected, and what to do next.

Toponexa turns live network checks, topology, maps, work orders, field tools, and a built-in VPN into one calm operations desk, so your team sees the failure story before customers start calling.

Credit card required for trials · Isolated organization data · Built for real ISP field work

Platforms: Web, Windows, Linux · Android app coming soon to Google Play

60slive checks
Risk Radarpredict weak spots
Root-Causeplain-language stories
Field Opsdispatch, tools, VPN
Explore the command center

Jump into the six workflows teams ask about first.

Each module is part of one operating loop: detect, understand, dispatch, and report.

What’s new

New this month: see more, plan better, fix faster

Six upgrades built from what ISP teams and dealers asked for. Plans are shown on each card.

Professional & Business

Latency Radar: heat map and “what happened”

One row per device and one coloured cell per hour show a bad night at a glance. Every graph now shows that device’s own usual range, marks what the device reported, and lists clues about the cause after a trouble period. Packet loss is measured with real probes, not a single ping.

Business

Network Engineering

Eleven planning and audit tools in one place: IP address manager with duplicate detection, port and VLAN audits, RF and fiber planners, backup readiness, a change planner with tickets, commissioning checklists and a site passport.

Professional & Business

Run tools inside the customer’s network

Ping, traceroute, port scans and DNS checks can run from the Agent on the customer’s own network, with live results in the page. SNMP capture saves everything a device answers into a file, so a new OLT or switch brand can be supported from real data.

Professional & Business

Sensors, logs and traps

Fiber light levels, temperature, voltage and CPU are read over SNMP and warn before a link fails. Syslog messages and SNMP traps from your devices become searchable events with alerts, and the Agent’s own internet line gets scheduled speed tests.

All plans

An Agent that keeps going

It updates itself, keeps checking and uploads results later when the internet drops, can start before anyone signs in on Windows, and a standby copy takes over if the first computer stops. It also warns you when its own computer has a problem.

All plans

A calmer, faster dashboard

The Dashboard now sits in four tidy rows with saved layouts for command, incident review, executive and compact laptop use, three themes, and slim headers that give small screens more room. It also works on older Windows 7 computers.

90-second walkthrough

Watch Toponexa turn a network issue into a field action.

A safe, demo-data product story built from public screenshots: detect the problem, explain the cause, trace the impact, and dispatch the fix.

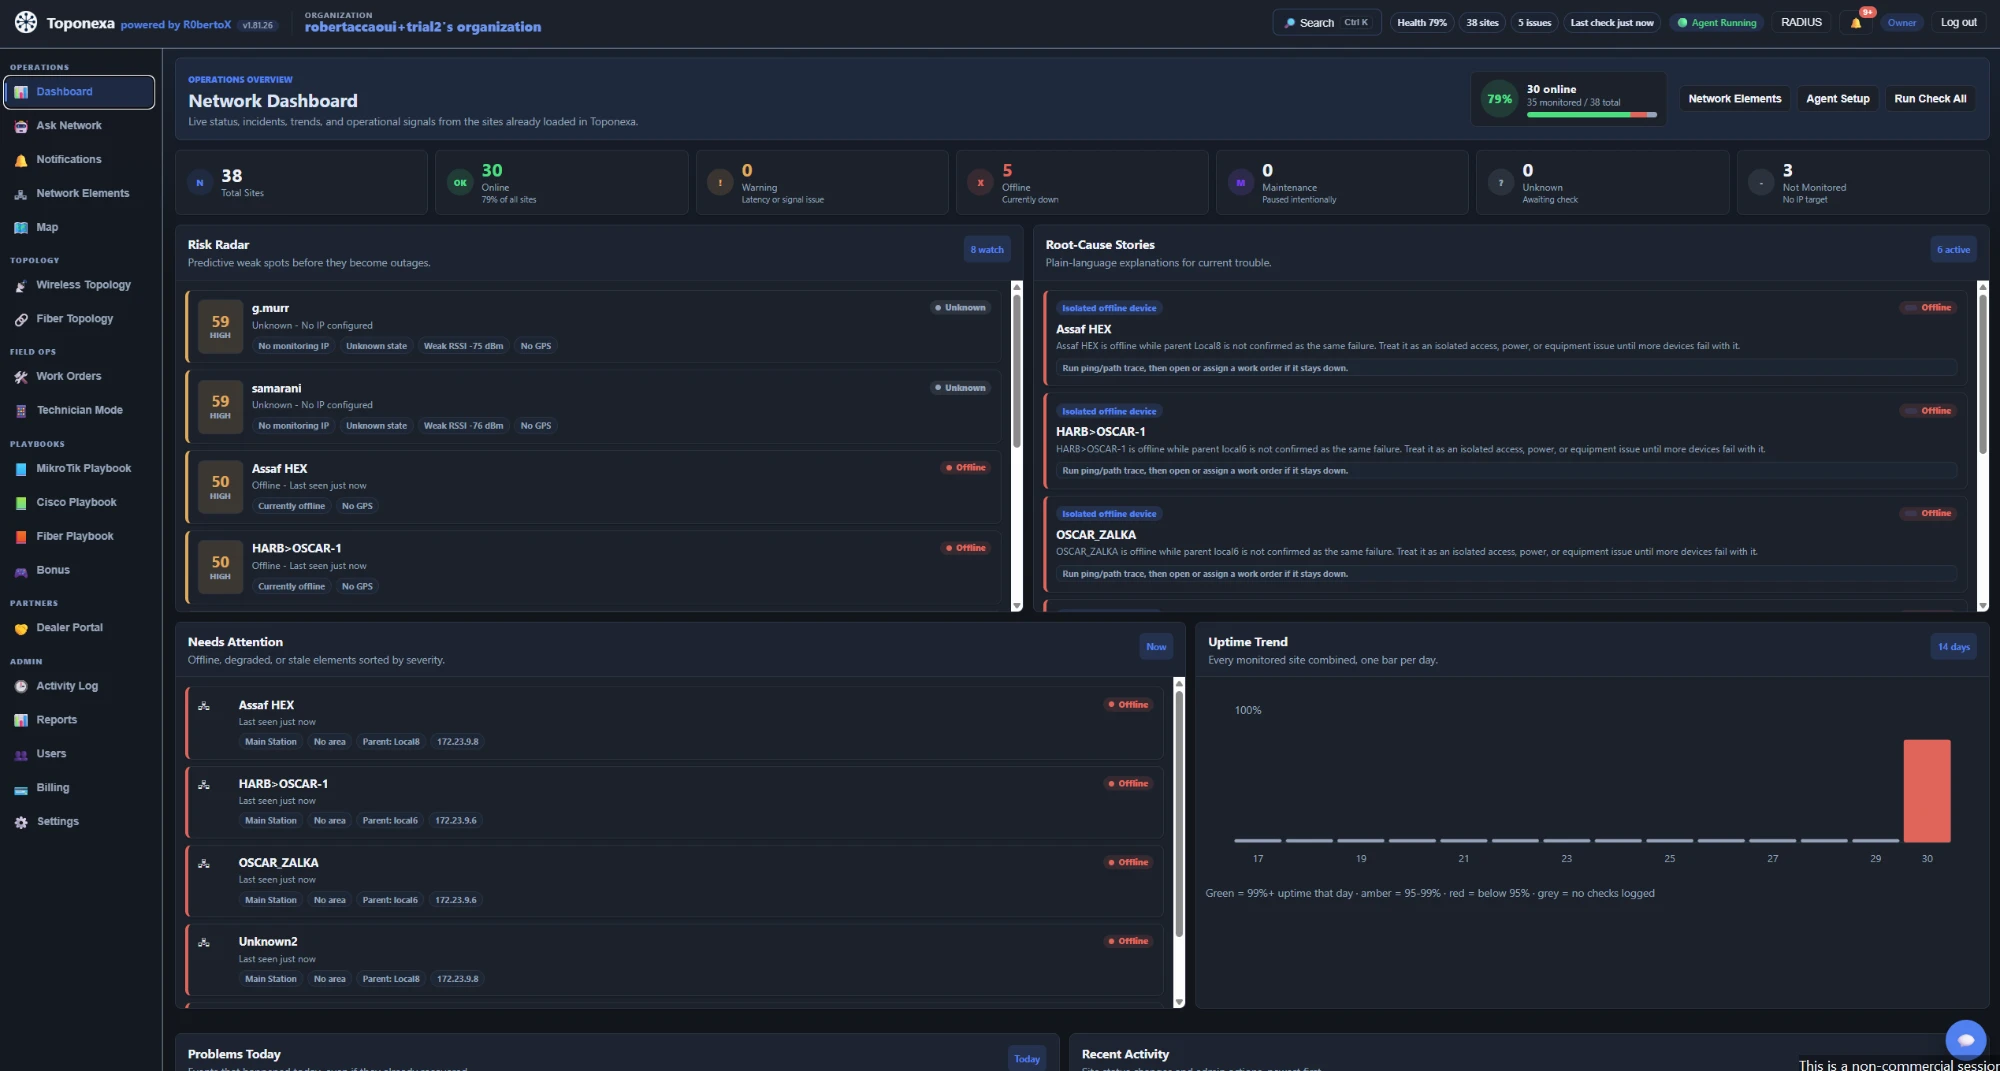
Toponexa dashboard with live health and risk radar
Step 01

Detect trouble before the calls arrive

Live checks, stale-agent warnings, and Risk Radar make the first problem visible fast.

01 / 06
Interactive app preview

Show the whole network story in one working screen

Click through a safe demo workspace that shows how Toponexa connects dashboard health, topology, work orders, and Ask Network without exposing real customer names.

Operations CommandLive health summary for the demo network
Demo data
92%network health
Latency risingSector Alpha - 128 ms - 4 clients
Parent link offlineRelay Node - downstream impact detected
Core stableBackbone checks passing
Core SW
Relay Node
Sector Alpha
12 clients
HighReplace sector power adapterAssigned to field team - due today
MediumVerify relay alignmentPhoto required before closing
LowCustomer impact note readySupport can send update now

Why did Sector Alpha go offline?

Likely parent power or link issue. Relay Node stopped answering first, then all downstream clients failed together. Check relay power, PoE, and uplink before visiting each customer.

Trace pathCreate work orderCustomer impact
Product view

The operations desk your network has been missing

Dashboard intelligence, network elements, topology, map, work orders, and reports work together as one flow, not six disconnected tools.

How Toponexa works

One connected workflow from install to repair

Every screen feeds the next one, so your team does not jump between monitoring, maps, tickets, notes, and command tools.

1Add sites, IPs, ports, parents, GPS, and categories.
2Monitor health with agent checks, SNMP, alerts, and stale-check detection.
3Explain the failure with root-cause story, topology path, and blast radius.
4Dispatch the repair with work orders, field notes, photos, and quick tools.
01

Detect

60 second checks, TCP, ICMP, SNMP telemetry, alerts, and stale-check detection surface the problem immediately.

Signal becomes visible
02

Explain

Risk Radar and Root-Cause Stories turn raw health into an operator-ready failure narrative.

Failure story is written
03

Trace

Topology, map, path trace, and blast radius show customers and downstream devices affected.

Impact becomes clear
04

Dispatch

Work Orders, Technician Mode, field notes, photos, and quick tools turn the issue into a job.

Field team gets context
05

Report

Reports and customer impact notes explain what happened, who was affected, and how it was fixed.

Loop is closed
Built for each team

Different roles, same live source of truth

Owners need confidence, operators need clarity, technicians need exact instructions, and dealers need a controlled view. Toponexa gives each one the right screen.

Owner

See risk before it costs money

Track health, issues, uptime, reports, billing capacity, and team activity without asking for manual updates.

NOC

Understand the failure fast

Jump from alert to root cause, topology, map location, quick actions, and customer impact in one place.

Technician

Arrive with the right context

Open the assigned job with device details, notes, photos, GPS, WinBox/SSH/Ping actions, and close-out history.

Dealer

Share access without exposing everything

Give dealers a clean workspace with role access, tab visibility, and organization-level isolation.

Before and after

Replace scattered troubleshooting with one calm workflow

Most teams already have tools. The hard part is stitching alerts, topology, field notes, customer calls, and reports together while the network is under pressure.

Before Toponexa
  • WhatsApp screenshots
  • Unknown parent paths
  • Manual customer impact guesses
  • Work orders outside the network view
With Toponexa
  • Live health and root-cause story
  • Topology and map in context
  • Customer impact ready for support
  • Field job created from the issue
Operational trust

Designed for real organizations, not demo-only dashboards

Toponexa keeps every workspace isolated, gives owners control over access, and keeps field tools tied to the right device context.

Organization isolationEach customer account stays separated at the data layer.
Role and tab accessOwners decide who can see operations, maps, playbooks, billing, or users.
Real tool launchWinBox, SSH, Ping, Traceroute, and checks stay tied to the selected site.
Audit-friendly workActivity logs, reports, and work orders preserve what changed and why.
Time saved calculator

Estimate the hours your team gets back

Use simple numbers to show how much time disappears into repeated troubleshooting, impact checks, and manual dispatch notes.

8team hours saved per monthBased on 18 incidents and 25 minutes saved each.
Why it feels different

Built around field operations, not just uptime checks

Generic tools tell you something is down. Toponexa connects the issue to the network structure, customer impact, and the repair workflow.

NeedGeneric uptime toolToponexa
Why did it fail?Mostly red or green statusRoot-cause story and parent context
Who is affected?Manual checkingTopology, blast radius, and map context
What should the tech do?Separate ticket or phone callWork order, tools, notes, photos, and close-out
Can dealers get access?Usually all-or-nothingRole access, tab visibility, and isolated organizations
What Toponexa does

Everything a network operations team actually needs

Built from real day-to-day ISP field work, not a generic monitoring template.

📈

Latency Radar & Heat Map

SmokePing-style graphs with real packet loss and jitter for every device, a heat map of the whole network, each device’s usual range, and a “what happened” summary with clues after a problem.

New · Pro & Business
🧰

Network Tools From the Agent

Ping, traceroute, TCP ping, port scan, DNS, SSL and subnet scan run for real, on your PC or from the Agent inside the customer’s network, with live charts and results.

New
🏗️

Network Engineering Workbench

IPAM with duplicate detection, port and VLAN audits, RF and fiber planning, config backup and drift checks, a change planner and site passports, built from the same inventory your team already uses.

New · Business
🤖

Ask Network AI Assistant

Ask plain-language questions about your own network, like "why is Salem flapping," worst PON right now, or SLA breaches, and get answers grounded in your real live data.

New
🧠

Predictive Risk & Root-Cause Stories

A Risk Radar ranks weak spots before they become outages, and Root-Cause Stories turn a failure into a plain-language explanation with upstream outage, local parent failure, or weak signal context, not just a red dot.

New
📡

Live Uptime & Real Device Telemetry

A background agent checks every site every 60 seconds with real ICMP or TCP, plus SNMP-polled RSSI, SNR, CPU, and uptime straight from the device. It is more than a ping.

Core
🕸️

Wireless & Fiber Topology

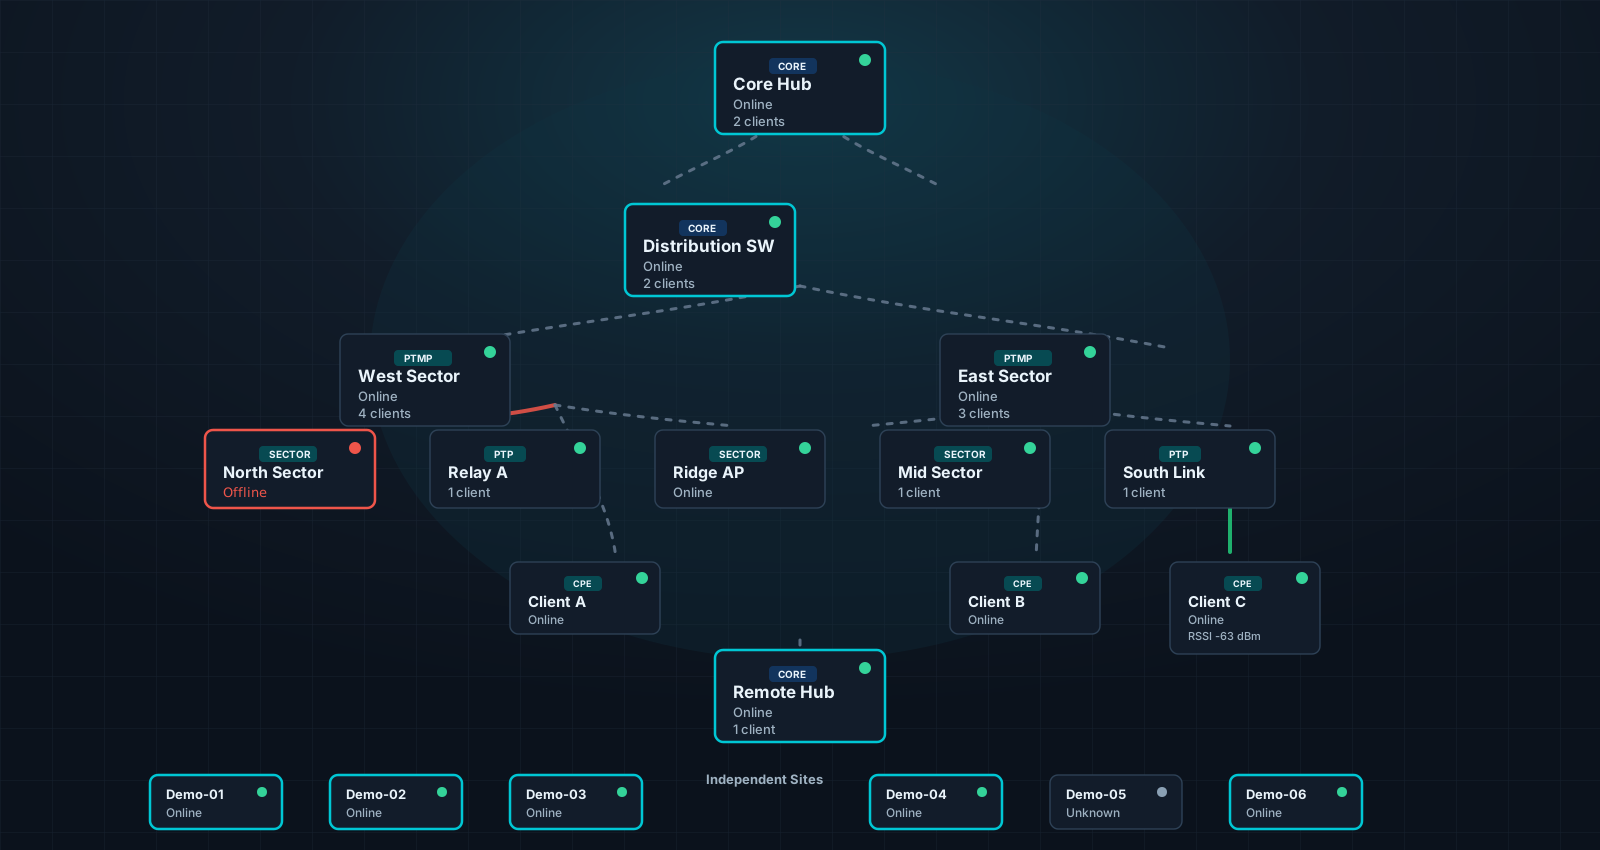
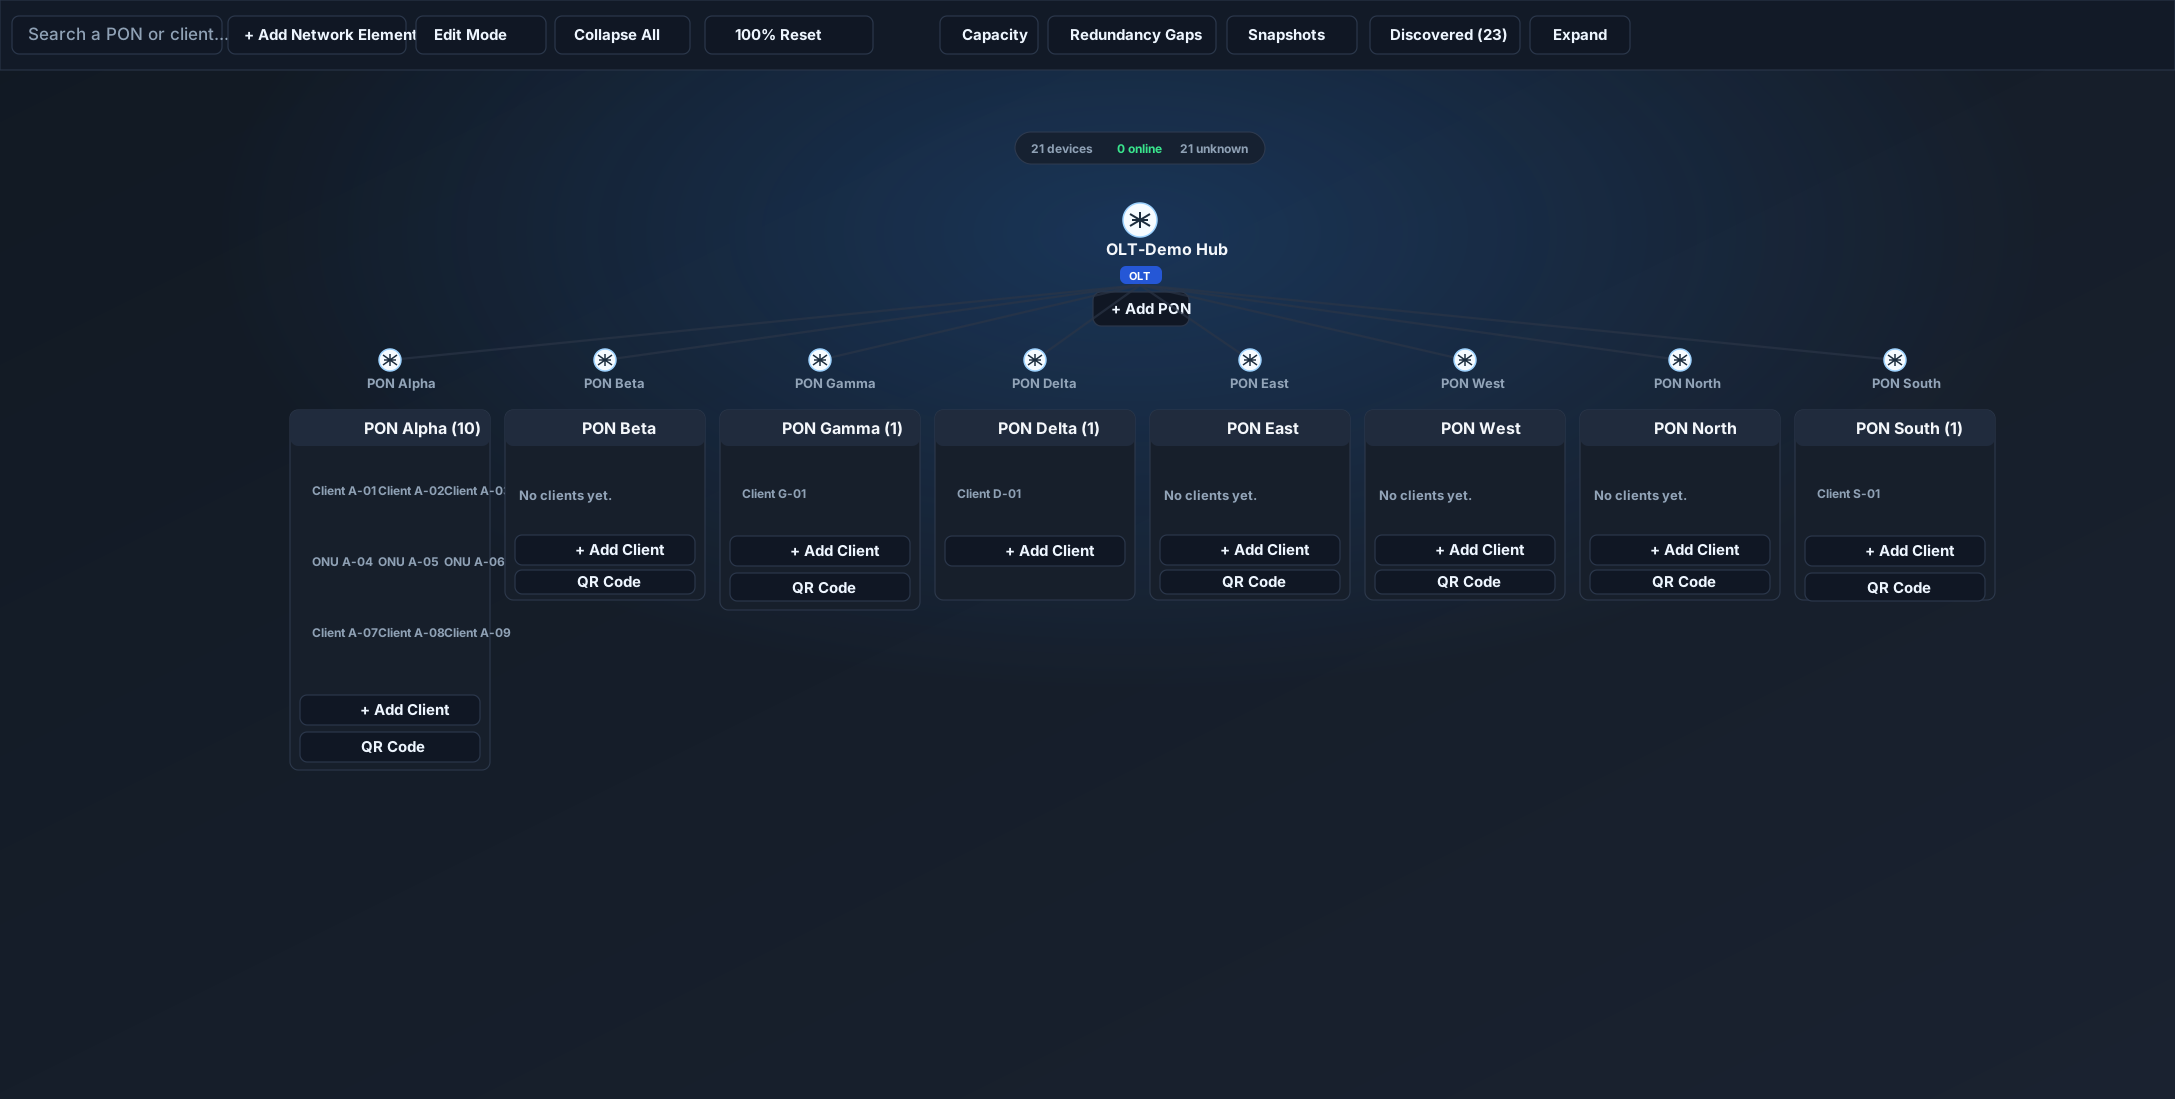
Automatic radial topology graphs are built from your actual network hierarchy, with separate views for wireless links and fiber/OLT chains, drag-to-pan, and live link-quality overlays.

Core
🔍

Auto-Discovery

Your AP or OLT already knows who's connected. Toponexa reads its SNMP client/ONU table and surfaces new, unrecognized devices ready to add as a site in one click.

Automation
🗺️

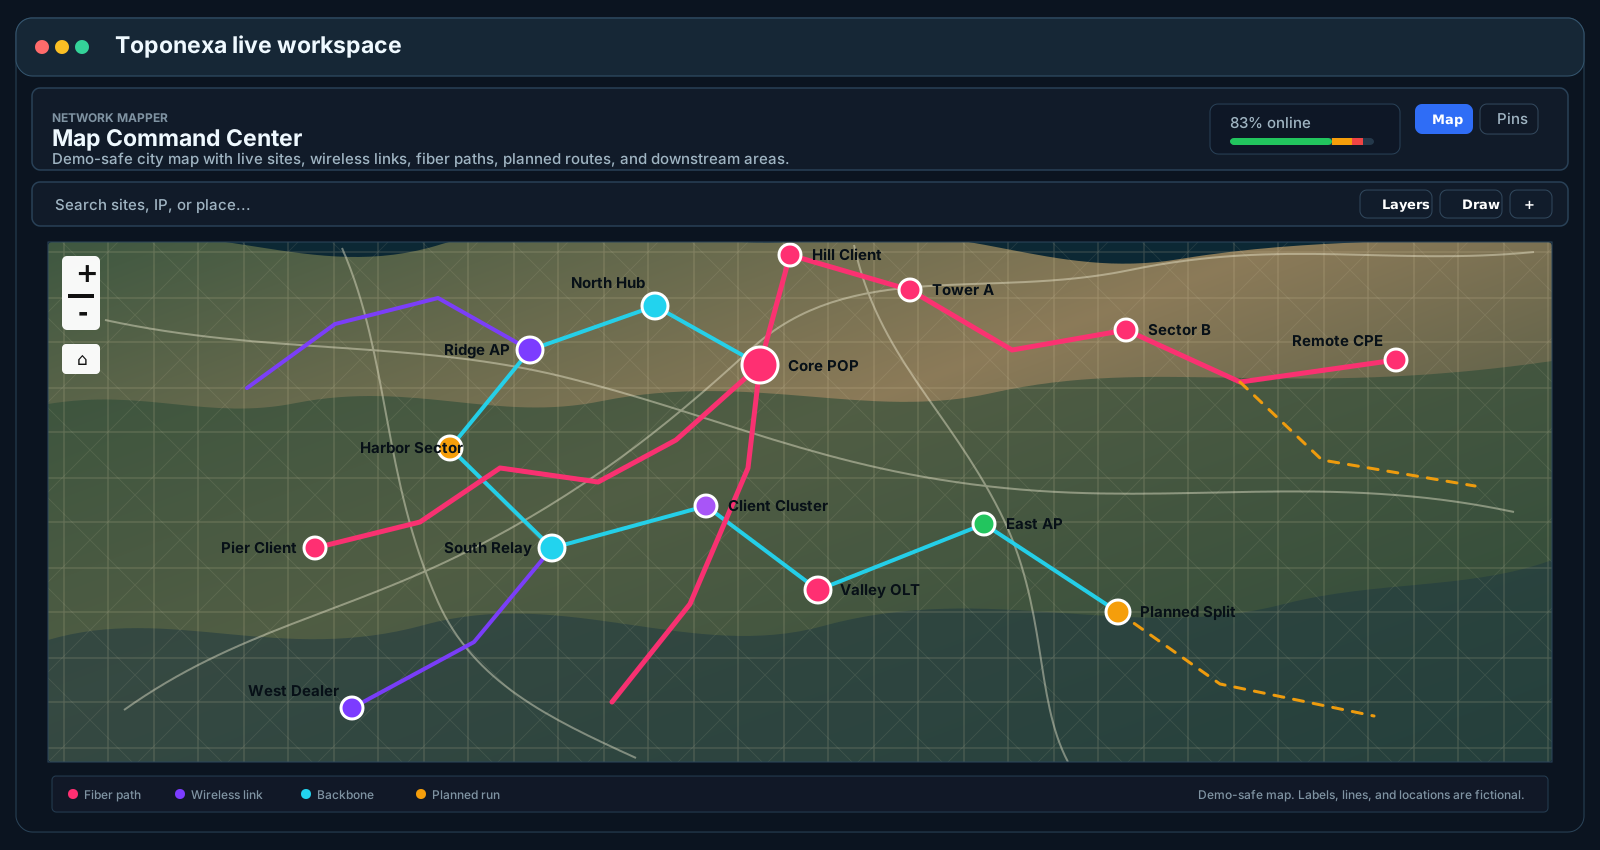
Geographic Mapping

Satellite imagery, freeform sketching for planned builds, and always-visible labels help you plan and document your physical network.

Core
💥

Change Impact Simulation

Blast Radius and Path Trace show exactly what's downstream before you touch anything, so a delete or maintenance window never takes down more than intended.

Ops
🧰

Field Operations & Work Orders

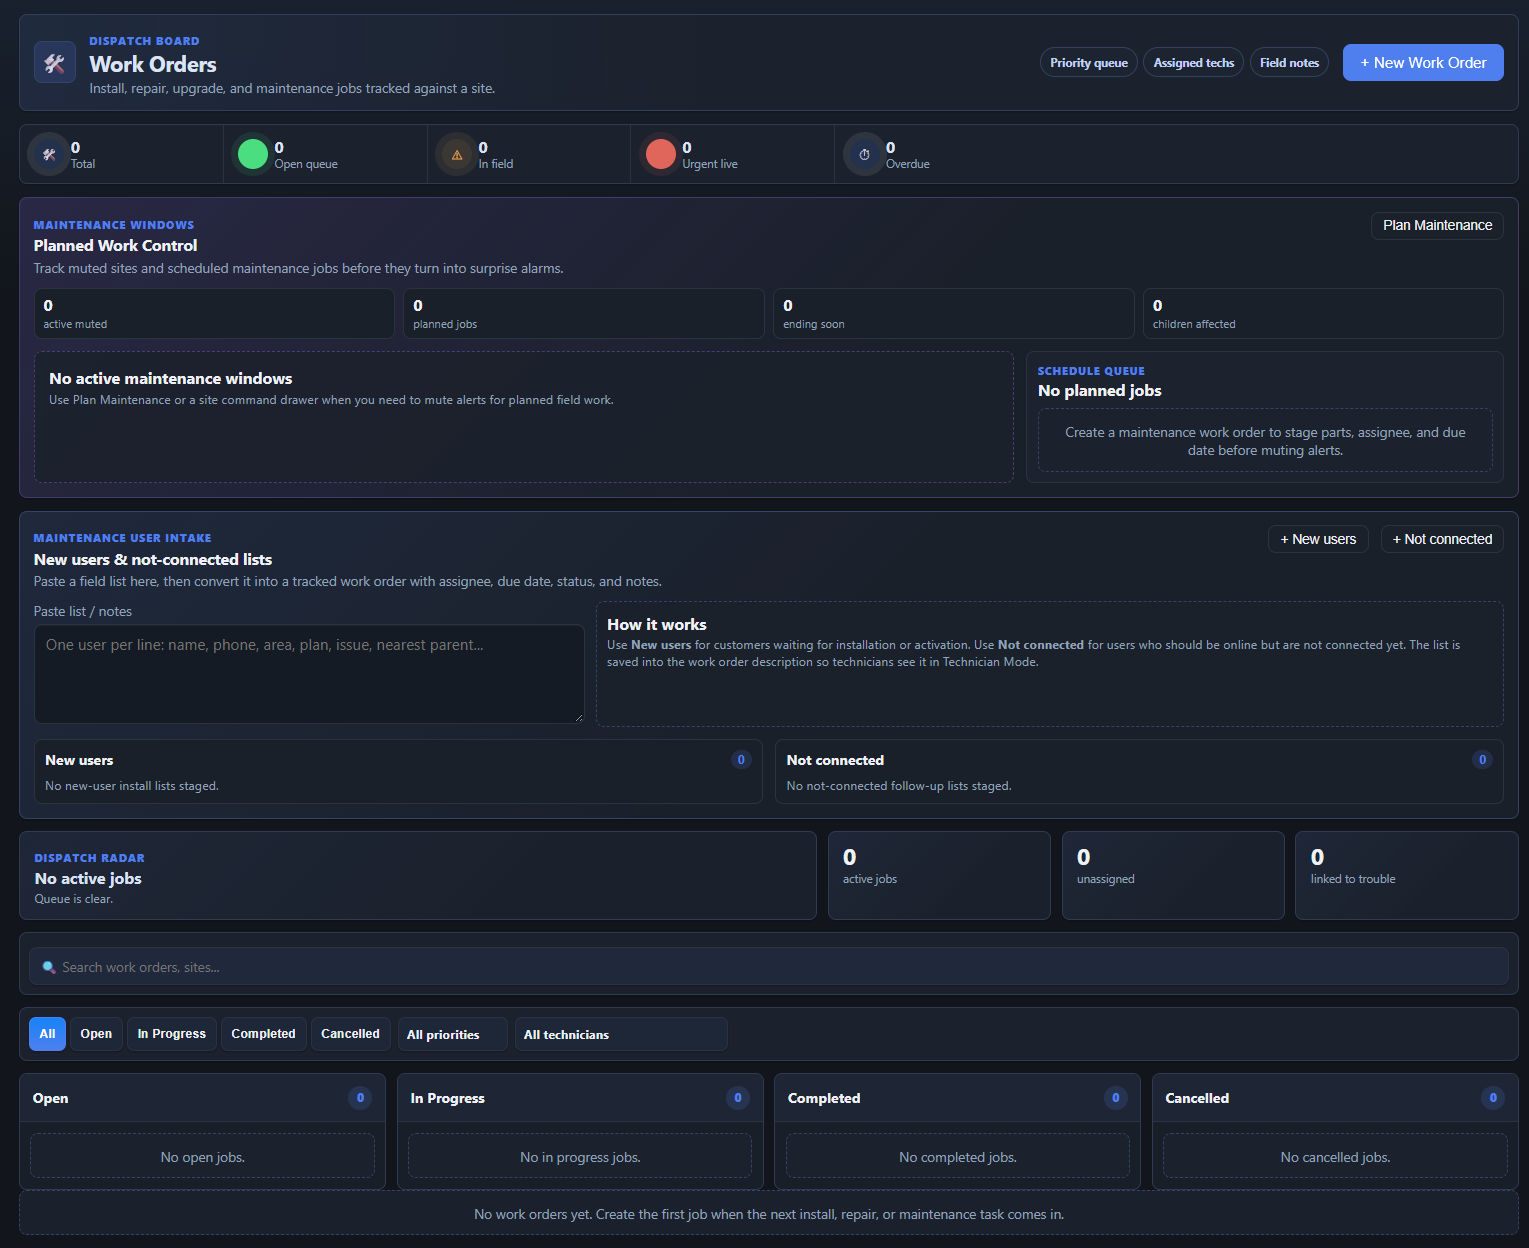
Dispatch radar, technician mode, maintenance windows, and quick customer intake for new installs or repairs keep the field team's whole workflow in one place.

Field Ops
🔔

Real Alerts

Telegram, ntfy, and Web Push notifications fire the moment a site goes down, configurable per site and per person.

Monitoring
🖥️

One-Click Field Tools

Real Ping, Traceroute, SSH, WinBox, and PuTTY launch directly from the browser through the native desktop app. Not simulated, not a copied command.

Field Ops
🔒

Built-In VPN to Remote Sites

Save your router's VPN once (PPTP, L2TP/IPsec, or SSTP) and connect from Toponexa with one click. Every site behind that router becomes reachable for Ping, WinBox, SSH, and the app, as if you were on site. Passwords are stored encrypted. Works on Windows PCs with the desktop app or the Local Helper, on the Professional and Business plans.

Field Ops
🔐

Role-Based Access & Dealer Portal

Owner, Admin, and Viewer roles include per-user tab restrictions, plus a dedicated Dealer Portal and RADIUS integration for reseller networks. Every organization's data stays fully isolated.

Security
📚

Cisco, MikroTik & Fiber Playbooks

300+ Cisco and MikroTik commands are built in, plus 24 Fiber Playbook topics covering FTTH architecture, OLT/ONU basics, splicing, OTDR testing, GPON, troubleshooting, and safety.

Knowledge Base
📊

Dashboards & Reports

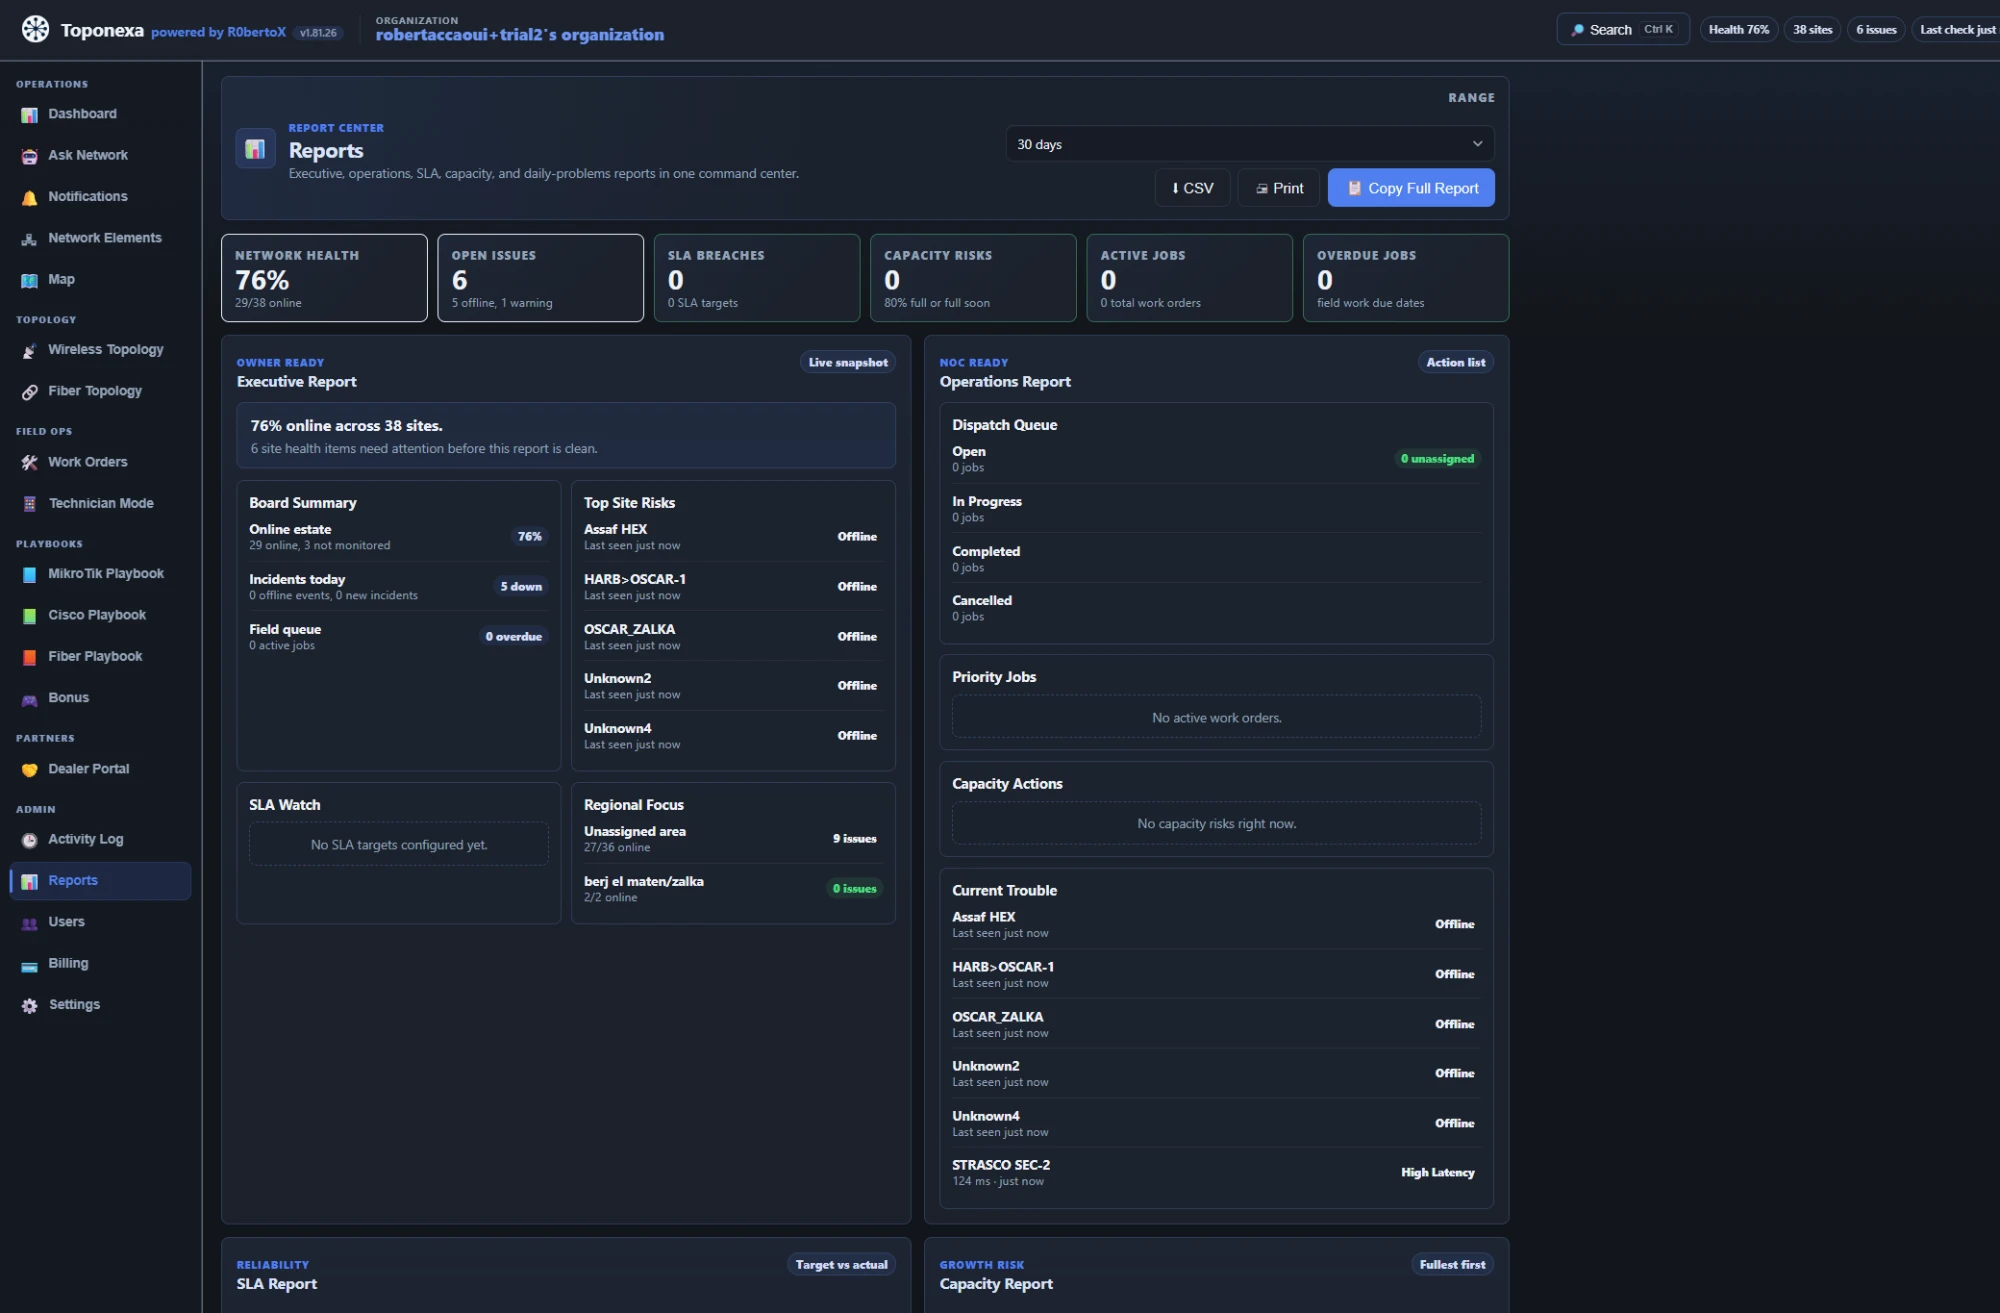
At-a-glance health tiles, executive and operations reports, an admin activity log, sign-in audit trail, and per-dealer uptime reporting.

Insights
💻

Windows & Linux Desktop Apps

Native apps for real OS-level access on Windows and Linux, plus a browser fallback for anything else.

Platform
60s
Monitoring interval
300+
Cisco/MikroTik commands + Fiber topics
100%
Data isolation between organizations
3
Platforms: Web, Windows, Linux
About Toponexa

Built by field engineers, for field engineers

Toponexa grew out of real, daily ISP operations. Every feature exists because someone actually needed it in the field.

🎯

Built From Real Use

Every feature comes from an actual field problem, not a feature checklist.

🔒

Security by Design

Row-level data isolation enforced at the database, not just hidden in the interface.

⚡

Genuinely Live

Real ICMP/TCP checks and live sync, not a dashboard that only updates on refresh.

🌍

For Any ISP, Anywhere

Whether you're a national ISP or a single dealer, your own isolated workspace works the same way.

Questions operators ask first

Clear answers before you start a trial

Toponexa is built for real ISP workflows, so the most important details are visible before setup.

Does Toponexa need an agent?

Yes for live background monitoring. The agent performs real checks and keeps statuses fresh while the web app stays focused on command-center visibility.

Can it monitor MikroTik, Cisco, and fiber networks?

Yes. Toponexa includes MikroTik and Cisco playbooks, fiber topology, SNMP details, PON and OLT workflows, and field tools for mixed networks.

Can technicians use it from the field?

Yes. Technician Mode and Work Orders keep jobs, notes, photos, maintenance status, and device actions together so field work is easier to close cleanly.

What happens during the trial?

You add a valid card, create an organization, test the app with your own structure, and can cancel before the trial ends to avoid subscription billing.

Is customer data isolated?

Each organization is isolated. Role access, tab visibility, dealer views, and admin tools help give the right people only the access they need.

Which plan do I need for which feature?

Starter covers live monitoring, topology, the map and alerts. Professional adds Risk Radar, Latency Radar with the heat map, the Agent extras (tools from the Agent, SNMP sensors, speed tests, device logs) and the desktop tools. Business adds Network Engineering, Work Orders, the Dealer Portal and escalation. See the pricing page for the full lists.

Does it work on older computers, like Windows 7?

The web app works on Chrome 109, the last version for Windows 7, and a Local Helper and a Windows 7 Agent build are available. We still recommend a current Windows when you can.

Can I import or organize many sites?

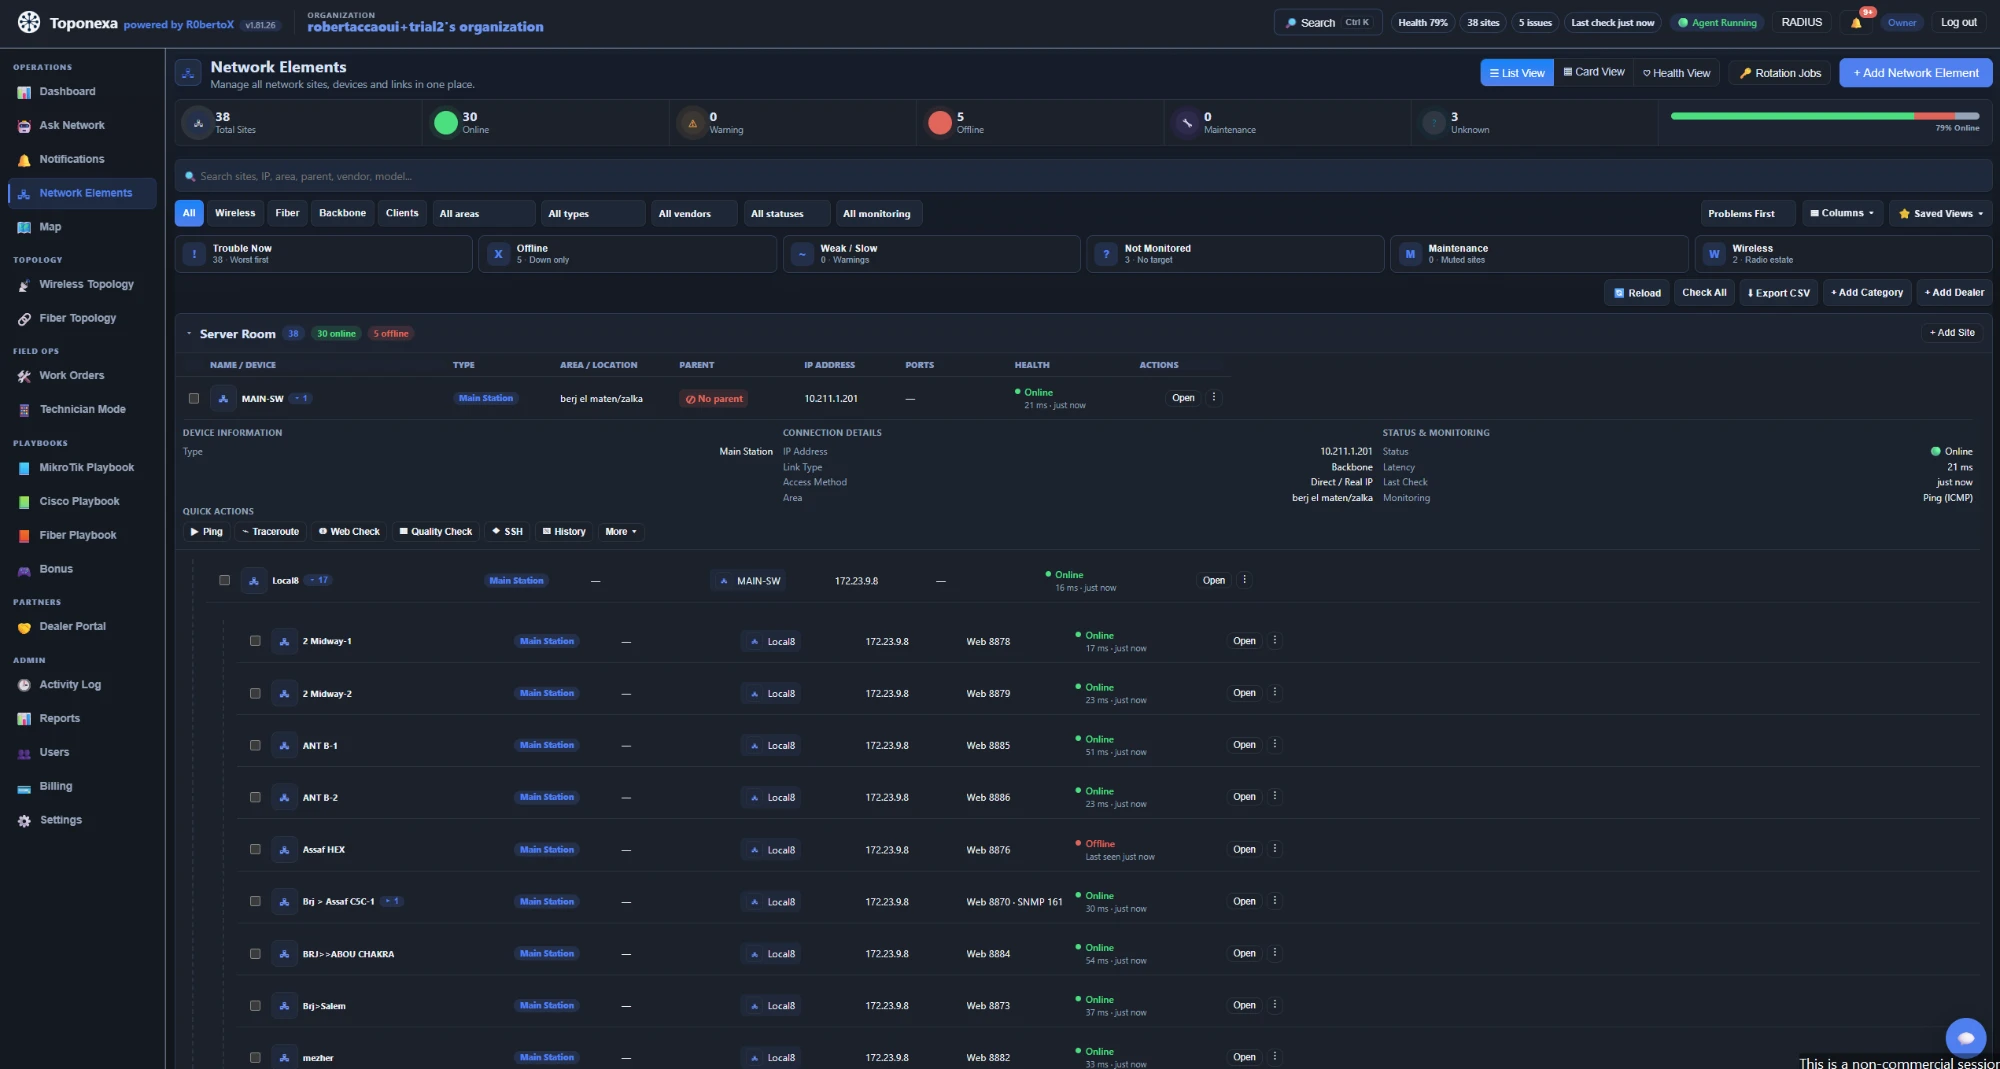
Yes. The Network Elements list supports categories, parents, IPs, ports, health filters, saved views, and column controls for larger operations.

Start with a real operations desk

Build your monitored network in minutes, then grow into the full command center.

Add sites, connect live checks, see topology, explain trouble, dispatch technicians, and report what happened from the same workspace.

7 daystrial access Cardrequired to start Cancelbefore billing Liveagent checks